UK Nation and Region
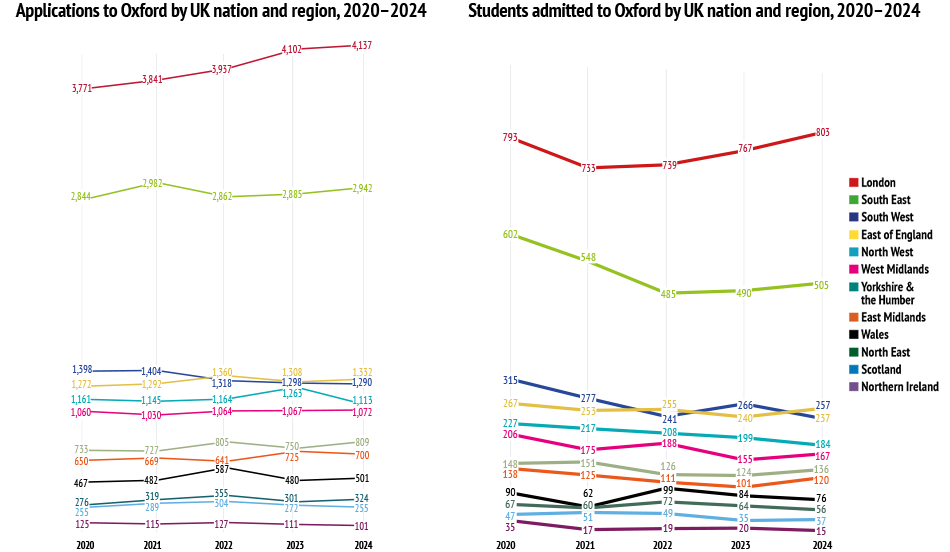
This page breaks down Oxford’s UK-domiciled undergraduate student total to show the regional distribution of the University’s applicants, offer-holders and admitted students.
- The regional distribution of admissions to Oxford reflects population size, achievement in school and application numbers.
- London and the South East made up 47.8% of UK applications between 2021 and 2023, and 49.0% of students admitted; the rest of the UK made up 52.2% of applications and 51.0% of students admitted.
Applications to Oxford, offers made and students admitted by UK region and nation, three-year total 2022–2024
| Applications | Offers | Students admitted | Proportion of Total UK Applicants | Proportion of Total UK Students admitted | Region’s share of AAA* Students4 | |
East Midlands | 2,066 | 386 | 332 | 4.7% | 4.3% | 6.0% |
East of England | 4,000 | 830 | 752 | 9.2% | 9.7% | 10.0% |
London | 12,176 | 2,577 | 2,309 | 27.9% | 29.9% | 20.1% |
North East | 980 | 218 | 192 | 2.2% | 2.5% | 2.5% |
North West | 3,540 | 668 | 591 | 8.1% | 7.6% | 9.1% |
Northern Ireland | 339 | 56 | 54 | 0.8% | 0.7% | 4.3% |
Scotland | 831 | 132 | 121 | 1.9% | 1.6% | 4.8% |
South East | 8,689 | 1,621 | 1,480 | 19.9% | 19.1% | 17.3% |
South West | 3,906 | 841 | 744 | 8.9% | 9.6% | 7.7% |
Wales | 1,568 | 276 | 259 | 3.6% | 3.4% | 4.4% |
West Midlands | 3,203 | 600 | 510 | 7.3% | 6.6% | 7.4% |
Yorkshire and The Humber | 2,364 | 455 | 386 | 5.4% | 5.0% | 6.4% |
Total | 43,662 | 8,660 | 7,730 | |||
4. See Context diagram below.
Context
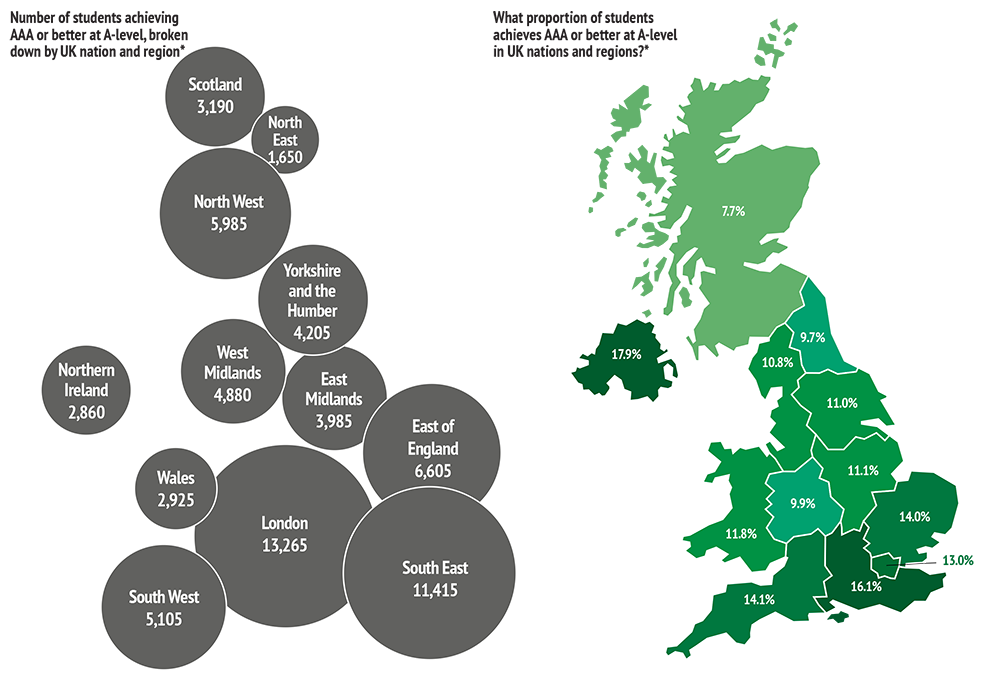
*First-year, first-degree, UK-domiciled undergraduate students, academic year 2021/22. Includes equivalent Scottish qualifications. See note on HESA data for full citation.
For further information on all Oxford's admissions statistics, including by course and by college, please read the Annual Admissions Statistical Report.
You may also be interested to see detailed statistics relating to UK regions, Local Authority areas and Parliamentary Constituencies.