Gender
Until 2023 Oxford University data used the binary male/female options from the UCAS application, which may not reflect the gender identity of all applicants. In 2024 applicants were able to select ‘I use another term’ or ‘I prefer not to say’; 2.6% of applicants (385) selected these options.
University-level data
- In each year from 2020–2024 Oxford admitted more UK-domiciled female undergraduates than male.
- In 2024 for the first time UCAS included the option for applicants to respond ‘I prefer not to say’: 223 applicants selected this, of whom 59 received offers and 50 were admitted (1.9% of acceptances).
- In 2024 for the first time UCAS included the option for applicants to respond ‘I use another term’: 162 applicants selected this, of whom 36 received offers and 27 were admitted (1.0% of acceptances).
UK applications to Oxford, offers made and students admitted by gender, 2020–2024
| I PREFER NOT TO SAY/ I USE ANOTHER TERM | FEMALE | MALE | FEMALE PRO- PORTION OF TOTAL UK STUDENTS ADMITTED | |||||||
APPLIC- | OFFERS | ADMITTED | APPLIC- | OFFERS | ADMITTED | APPLIC- | OFFERS | ADMITTED | ||
2024 | 385 | 95 | 77 | 7,162 | 1,571 | 1,355 | 7,147 | 1,330 | 1,180 | 51.9% |
2023 | 7,444 | 1,551 | 1,337 | 7,192 | 1,354 | 1,223 | 52.2% | |||
2022 | 7,383 | 1,495 | 1,379 | 7,186 | 1,311 | 1,217 | 53.1% | |||
2021 | 7,411 | 1,542 | 1,486 | 6,990 | 1,239 | 1,205 | 55.2% | |||
2020 | 7,110 | 1,661 | 1,598 | 6,992 | 1,398 | 1,352 | 54.2% | |||
Context
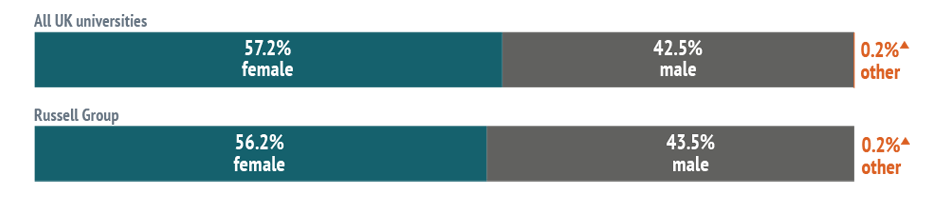
Breakdown of students at UK universities by gender (2021 UK intake)*
Oxford University (2024 UK intake)

Breakdown of students achieving AAA or better at A-level by gender
(all UK universities, 2021 UK intake)*

*Most recent available national data covers 2021 intake: defined as first-year, first-degree, UK-domiciled undergraduate students, academic year 2021/22. AAA+ pool includes equivalent Scottish qualifications. See note on HESA data for full citation.
▴Other gender: percentages are too small to represent in diagram.
For further information on all Oxford's admissions statistics, including by course and by college, please read the Annual Admissions Statistical Report.
You may also be interested to see detailed statistics relating to gender.